Most asset managers and stock pickers' goal is to generate alpha, meaning to outperform the market by superior ability. One of these is Jim Cramer, host of CNBC's "Mad Money with Jim Cramer" show, featuring fiery market commentaries, stock recommendations and everything in between.
Jim is a fabled stock picker with an extraordinary ability to pick stocks that keep on... losing. A lot. So much so that there is a bountiful collection of Jim's picks and the subsequent stock movements in the exact opposite direction. In fact, there were so many that people started calling it the "Jim Cramer inverse indicator" - basically, always go the opposite direction of what Jim recommends, and you will make money.

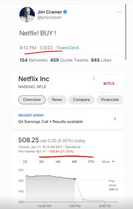


Credit: Wall Street Memes, Instagram: @wallstbets
Though what started as a meme evolved into a business - there is already an ETF tracking the performance of Jim's picks - just in inverse.
The natural question arises - do Jim's (inverse) picks really generate alpha? We can rephrase it as: are Jim's picks so wrong so consistently that you would outperform the market by consistently doing the opposite?
We can test it out quantitatively!
Note: This post serves solely as a fun project to learn coding, the basics of sentiment classification, and creating strategies with Python. In no way does it represent or recommend the actual trade of the strategy.
Project areas
The project is a great exercise to practice our coding and discover different areas of coding than just pure finance. Let's look at the project's structure and what skills we will need to accomplish it.
Scraping the tweets
Twitter is Jim's primary communication channel about his stock picks (except for his TV Show) and the main source of all the memes. Thus, we will need a way to scrape his tweets to obtain his ideas about different stocks, which is an excellent data collection exercise.
Getting stock data
In our last project, we predefined tickers whose prices we downloaded from Yahoo Finance. This time, we will also need names of the stocks assigned to the tickers for a more robust classification. Again, it is a nice data collection exercise.
Assigning stocks to the tweets
This is the truly difficult part, as Jim is a human, not a machine. As we will see later, the text in his tweets are somewhat messy and not exactly standardized. To the human mind, $AAPL, AAPL, Apple, or Apple Inc. makes little difference, and we have no problem recognizing what the traded ticker is.
However, these are almost completely different for a machine, and we will have to develop a robust way to recognize which stock Jim is talking about, with as few manual interventions as possible. This is truly an excellent data handling exercise not only for finance.
Classifying sentiment
Another challenging part is deciding whether Jim recommends the stock based purely on the text. As humans with basic finance knowledge, we know that Jim recommends a stock to buy when he says, "$AAPL is undervalued, should go higher," but how does a machine know?
We will have to build a sentiment classification algorithm, which gives a little insight into the NLP (natural language processing) area of data science. Of course, building such an engine from scratch takes time and is far beyond the scope of this post. Thus we will rely on open-source libraries available in Python.
Building a trading strategy
When we know what stock Jim is talking about, whether he likes it or not, and when he makes the recommendation, we can start building our trading strategy. Because the nature of the data is quite unique and we will be trading single stocks, we will have to devise clever rules to make the strategy as realistic as possible, which is an insight into the data handling and finance intuition department.
Analyzing the strategy
The last part of any trading strategy is to visualize it, check its plausibility, and make adjustments if needed. Because of the nature of the strategy, we can again create some specialty functions, which is a great data visualization exercise.
With the structure laid out, let's start!
Our code
You can find the complete code and necessary data files in this GitHub repository. Make sure to download it to make sure the code runs properly. Don't worry if it's too much all at once - we will take you through the code piece by piece!
Let's begin by importing the necessary modules and a parameter file in .yaml format, which specifies how our scripts should behave. We will visit individual parameters throughout the code.
Key packages here are:
snscrape for scraping tweets
yfinance for downloading stock price data
nltk, textblob, stanza for sentiment classification
Let's scrape Jim's Twitter
We'll be using the "snscrape" package to scrape Jim Cramer's Twitter using his handle @jimcramer. A detailed instruction can be found in this Medium article or in the official GitHub repository of the package.
In our implementation, we:
Scrape the tweets using snscrape
The tweets are ordered from newest to oldest; we only keep those newer than a date specified in our parameter file by comparing the timestamp
Append the tweet and its metadata to dataframe
Additionally, we create a simple if-else statement to decide whether to load the tweets fresh or whether to use an already prepared .pickle file with roughly 4 years of tweets*.
* Because of rapid news changes at Twitter, the snscrape library currently returns an error when trying to scrape; thus, for the purposes of this article, use the database provided and set the parameter 'load_twitter' to 'False' in the params.yaml file.
Data inspection - Tweets
It is always a good idea to inspect the data you are working with to find its structure, how to process it, and also to discover possible outliers or unique observations to decide how to handle them.
What we are mostly interested in right now is finding a pattern or structure in his tweets for assigning the stocks he mentions, if any.
Let's look at several chosen examples:
Example 1.:


Now we see that Jim's tweets sometimes mention a stock using the most standard convention: a dollar sign "$" followed by the ticker, as with Amazon or NVIDIA in the pictures above. That gives us the first idea of how to extract the stocks contained in the tweets; go through each tweet and find expressions beginning with a "$". The characters after that will be the stock in question.
Example 2.:
What if Jim makes it harder for us and doesn't mention the stock using the "$" but simply tweets the ticker, such as in the picture below?

The stock in question is Snap Inc. (formerly Snapchat), the social media platform. As humans, we can clearly see that it is a ticker for this particular stock, but what about a computer? We do not have the luxury of having an "anchor" in the form of a dollar sign, as before, which clearly identified the ticker.
One option would be to take any word which is all-caps as the ticker. That has two dangers:
We would miss tickers that Jim would not capitalize (aapl, amzn, snap, etc.)
It would incorrectly classify frequent words such as "FED," "USA," "NYC," or whole exclamation sentences as "THIS IS GREAT!" as stocks
The second option is to create a universe of tradable stocks with their tickers and then compare each word in the tweet with the list. If a word is found in the ticker list, then we are sure it is a company and will assign it to the tweet.
Example 3.:
So far, assigning was easy, given we are dealing with tickers, which are, by definition, a standardized expression. But what if Jim doesn't mention a stock using its ticker but rather a full name (Apple) or even a shortcut ("Bed Bath" instead of "Bed Bath & Beyond")?

This is the most challenging variation; many would simply drop the tweets with such mentions. Two general approaches are as follows:
Word similarity comparison. We could take each word and compare it with all the names in our database. A useful package for that is "difflib" with its "SequenceMatcher." Despite being an elegant approach, our universe is too broad, and names are often similar: JPMorgan Chase vs. Morgan Stanley or Abbot with Abbvie, or many stocks carrying the name "American."
List comparison. Once again, we can create a list of names for each stock and check whether a word from Jim's tweets is located in this list. The complication is again that many stocks have formal names that we wouldn't usually use: everybody simply says "Apple" or "Google" instead of "Apple Inc." or "Alphabet Inc.". We can fix that with a little bit of manual work - meaning adding a list of alternative names to a company. That way, we will also be able to add new tickers ultimately if we wish to.
Before we start building the assignment function, let us continue building our data basis - namely, the tickers, names, and, most importantly, stock prices.
Getting stock data
We will again use the yfinance package to obtain prices as we did in our momentum strategy article. The question is, which stocks should we consider?
We want to maximize our chances of having a stock mentioned by Jim in our universe, but at the same time, we want to be computationally effective and not clutter our data with thousands of small-cap stocks which will probably never be mentioned. A good compromise will be using the S&P500 stocks, which should contain most of the stocks Jim tweets about. Then, we can manually add certain "meme stocks" or crypto coins such as Dogecoin, AMC or FTX.

Credit: Imgflip
Let us borrow a code to scrape tickers and names of the S&P500 constituents. The code accesses a Wikipedia page with a table listing all the constituents, and using a standard "beautiful soup" scraper, we find the table, access its elements and save them. We also replace "." with a "-" to adhere to Yahoo's convention. An example of a stock with a "." in its name is Berkshire Hathaway with a ticker "BRK.B", but Yahoo lists it as "BRK-B". Lastly, while we are at it, we clean the tickers from "Inc." suffixes:
Adding alternative names and tickers
As discussed before, it might be useful to add alternative names to existing tickers or even add entirely new tickers (which have to be consistent with Yahoo Finance). Let us not overcomplicate matters and create a simple Excel file with three columns: "ticker," "alt_name" and "alt_name_2." An example Excel file will be provided in the GitHub repository, but you can create your own as well; just make sure the columns are named correctly.
Let's load the Excel file and perform an outer join so that the two new columns are appended to the corresponding existing tickers and that new rows with manually added tickers are added as well:
Now that we finally have a ticker list, we can use it to download prices from Yahoo Finance as we did before. We will specify the end date as the latest date in scraped Tweets, the start date will be obtained from our parameter file.
Again, we can either load the prices "fresh" from Yahoo and pickle them by setting the parameters "load_yahoo=True," or set it to False if we don't want to load prices every time we play around with strategy parameters. Lastly, we will format the index "to_datetime" and calculate the percentage returns of the stocks.
Assigning stocks to tweets
Now, the truly difficult part begins - extracting mentions of stocks to particular tweets. We discussed the three options above, so let's jump right into it.
We will write a function that will take a single tweet and our dataframe with all available names of stocks with tickers matched to it. Once written, we will apply this function to all tweets, i.e., rows of the scraped tweets.
Let's initiate the function and call it "asg_ticker" for "assign ticker." The first argument, "t," is a single tweet, and "tickers_names" is a dataframe containing tickers and names, which we created with the name "tickers_new" in the chunk above.
The steps and the first lines of the function are as follows:
We fill N/As with the string "Missing," which will be necessary later
Initiate an empty list for storing found tickers
Clean tweet from special characters and numbers. Without this cleaning, the function would not find the ticker in a tweet like "Strong earnings from AAPL!!" or return incorrect tickers in a tweet like "I see price target of $50 for $KO!!!"
Continuing the function, we create the first case for extracting tickers, that is, when they are marked with identified with a dollar sign.
We split the tweet into individual words, and then, with list comprehension, we extract the ticker. If you have not yet worked with list comprehensions, it is an elegant, one-line for loop. We loop through the t_split list containing all words and check whether the word starts with a dollar sign. If it does, we return x[1:], that is, everything after the dollar sign, which is the ticker we want.
Then, we add it to our found_tickers_list.
Let's move to option 2:
The logic here in option 2 is very similar; we again use list comprehension to loop through the split tweet and check whether any word is found in the column "ticker" in the provided dataframe. Another condition is to omit the ticker "A" - this is a discretionary decision because "A" is the ticker for "Agilent Technologies," which is not mentioned very often but is also a frequently used article in the English language. The code would thus mistakenly assume that this stock is mentioned even though it is not. Again, if anything is found, we add it to the list.
Lastly, let's dissect option 3, which is somewhat different:
Now we flip the logic: we do not loop through the tweets and check if any of the individual words are found in the tickers list, but we loop through rows of the dataframe with names and check if any of the three possible names are in the tweet. If yes, the code returns the corresponding ticker associated with the name.
So, why do we flip the logic now instead of checking whether the words are not found in names? The reason is that many stocks have names with two or more words, such as "JP Morgan" or "American Airlines." With the first approach, a tweet "American Airlines is a strong buy" would result in a list of words ['American,' 'Airlines,' 'is,' 'a,' 'strong,' 'buy']. Then, the code would futilely try to find "American" and then "Airlines" among the names. Thus, we try to find the names in the whole tweet.
The second question is, why don't we use this logic and try to find tickers this way as well? The reasons are mostly, but not solely, single-letter tickers such as $V for Visa. Look what happens if we try to find this ticker in a basic sentence containing the letter "V":

Therefore, this logic would not work for tickers as the "in" looks at whole strings as sentences, not individual words. Let us now try a model sentence with all three options and also some false tickers to test the function.
We would expect that the function return tickers "JPM" for JP Morgan, AMZN and KO (Coca-Cola) while ignoring the article "A" and also the price target "$50". Let's execute the two lines above:

Great! Our assigning function is set up, so let's run it on all the tweets.
To keep proper track, we copy our existing dataframe and create a new column where the tickers potentially found in tweets will be assigned.
Sentiment analysis
In the following part, we will try to determine whether to go long (buy) or short (sell) a stock mentioned in the tweet, or neither. As described in the project areas, we will utilize sentiment analysis for this task.
Sentiment analysis and Natural Language Processing (NLP) is its own exciting and diverse field of data science way beyond the scope of this article. Coding our own engine would be a difficult and complex task, which is why we will rely on open-source libraries, which are easily deployable. The downside is twofold - without deeper digging, they are kind of a black box and we do not know what's happening under the hood. Secondly, they are not necessarily trained for finance texts such as FinBERT by Google, which is an advanced neural network for classifying finance texts.
Anyway, we will deploy a simple approach of using three open source libraries (NLTK, Stanza, Textblob) to classify each tweet. Depending on our setting in the param file, we can choose a combination of these three by turning them on/off. Additionally, we can also weight the classification of "textblob" classifications by subjectivity. After our libraries are done classifying the tweets, again depending on our setting in the param file, we will either take an average of the classifications or take the biggest absolute value (with the correct sign) as our final sentiment. That way, our function will produce a sentiment class between -1 for negative sentiment and 1 for positive sentiment.
Now, we are ready to classify the sentiment of the tweets! As before, we create a copy of the dataframe and call it "tweets_sent." Then, we will filter out only those records where any stocks are assigned - it would be useless to classify tweets which we will not act upon. Lastly, we will run our new function on each tweet using the .apply function.
Trading strategy
We have almost everything we need for trading - stock returns, tweets, sentiment and assignments. Now, we only need to devise some trading rules on what weights to assign to the stocks we found in the tweets. Before we do that, let's prepare our dataframes to avoid any potential errors:
In the chunk above, we do the following actions:
Create a simple function that shifts any day which, is a Saturday or a Sunday to a Monday - needed because we cannot trade on the weekends, but Jim can tweet on these days
Get rid of time from the tweets and keep only the date
Create a weights index and weights dataframe, where we will store our weights for stocks later
Reindex returns dataframe to be consistent with the weights dataframe. There are no returns on public holidays and they are thus missing
Add another index to the tweets_clean dataframe, because of the non-uniquess of dates (multiple tweets a day from Jim)
Now that we have our data structures ready, we start a loop to assign weights of the stocks depending on set-up rules.
We loop through the index of our tweets dataframe and do the following actions:
Save tickers in a new temporary variable
Check whether the assigned (absolute) sentiment is lower than a specified value from our param file. We might want to do that if we consider only tweets with strong/high sentiment, where the probability of it being a stock recommendation is higher. If the value is lower, we skip it and go to the next tweet
If not, we have two options from the params file:
Either we consider only the sign of the sentiment classification as the direction of the trade - positive sentiment for long and negative sentiment for short. Then, we multiply it by -1 to create the "Inverse Cramer effect." The weight will then be either -1 or 1
Or we also consider the magnitude of the sentiment. Thus the sentiment will also become the weight of the stock (e.g. 0.55)
Continuing, we now loop through all the tickers found in the tweet. We print a warning message if the ticker is not in our universe. If it is in our universe, we continue by:
Determining the starting day for our investment by taking the day of the tweet and lagging it by a certain number of days as a trading lag. The default in our parameter file is one day
Then we need to determine the ending day until the position is held. We again have two options:
Either we can take profit by enabling "take_profit" in our parameters file and setting the desired percentage. Then, we utilize a function (tp_date) which we wrote to tell us how many days it takes for the given stock to reach the specified profit. If it is shorter than our specified holding period, i.e., if it only takes 20 days to reach a profit of 30%, we will hold it for that many days.
Otherwise, if the stock doesn't reach the specified profit sooner than our holding period, we simply hold it for the days specified
Lastly, we need to determine what kind of weight assignment we apply. We have three options which we can turn on/off in the parameter file:
Cumulating the weights; even if there is an existing position (either positive or negative), we simply add to the position if there is another tweet about a given stock (we will take budget and leverage constraints later)
Overwriting; we ignore the positions and overwrite the weights if there is a new relevant tweet for the stock: this means we can either prolong holding of a stock or switch it from positive to negative or vice-versa, depending on the tweet's sentiment
Only inactive stocks: if both are turned off, we fill only positions that are yet inactive and hold them as specified by our rules, without the possibility of cumulating, overwriting and changing legs
Almost there! Now that we have the individual weights, we need to scale them to adhere to our budget constraints. Because we keep adding stocks throughout time but have a limited amount of cash we can allocate, we would have to rebalance the portfolio to reach the desired weights with available cash.
We will write a simple function that takes into account that some positions are short and some are long. Moreover, we will use a short cap of -1, meaning we can short a maximum of 100% of our own capital and a long cap of 2, meaning we use our own capital and then use the extra proceeds from shorting to buy additional stocks.
Now we only have to multiply our returns dataframe with the weights dataframe to get returns of individual positions, sum them up to get portfolio returns and use our portfolio analytics class to carry out some analyses!
Analysis
Does the strategy with our current set up work? Let's take a look!

Firstly, we can see that the strategy achieves much higher total return but with way steeper drawdowns. The reason is twofold:
Leverage: we are also short-selling stocks and buying even more stocks with the proceeds
Lack of diversification: our portfolio is way more concentrated because of the setup and the holding period is also way shorter
Let's look at the strategy through numbers:

We can confirm that the strategy indeed outperforms the benchmark in terms of average return, but also in terms of Sharpe ratio, controlling for risk/volatility. The main question remains: does the strategy generate alpha, i.e., does (inverse) Jim Cramer have superior picking and timing ability?
According to the summary, even if statistically significant, the alpha is minuscule (0.05%) and thus not economically significant. We can also see that beta is very close to 1, meaning most of the returns are driven by the market itself. That is probably due to Jim mentioning big names (Apple, Amazon) most of the time, which are primary drivers of the S&P500 anyway.
Homework
The visualizations are very basic and capture only part of the image. For going the extra mile and trying out more advanced visualizations, try the following:
Animated number of mentions of top 10 stocks: https://matplotlib.org/stable/users/explain/animations/animations.html
A summary of which stocks realized the biggest profit/loss and when. This way, we can analyze individual tweets and whether the sentiment classification was correct
Animated weights in the top stocks
Correlogram of the strategies
Correlogram of sentiment and returns for top 10 mentioned stocks
Summary
We played around with different areas of coding – scraping, news sentiment, data cleaning and portfolio management - to devise a fun trading strategy, putting the meme to the test. With the setup above, we see it actually can work. However, it is not much better than simply holding the market.
Nonetheless, there is still much room for improvement in terms of strategy setup, better stock assignment and better sentiment classification (i.e., direction detection) – therefore, go ahead and play around! Happy coding!